By Rachel Starry
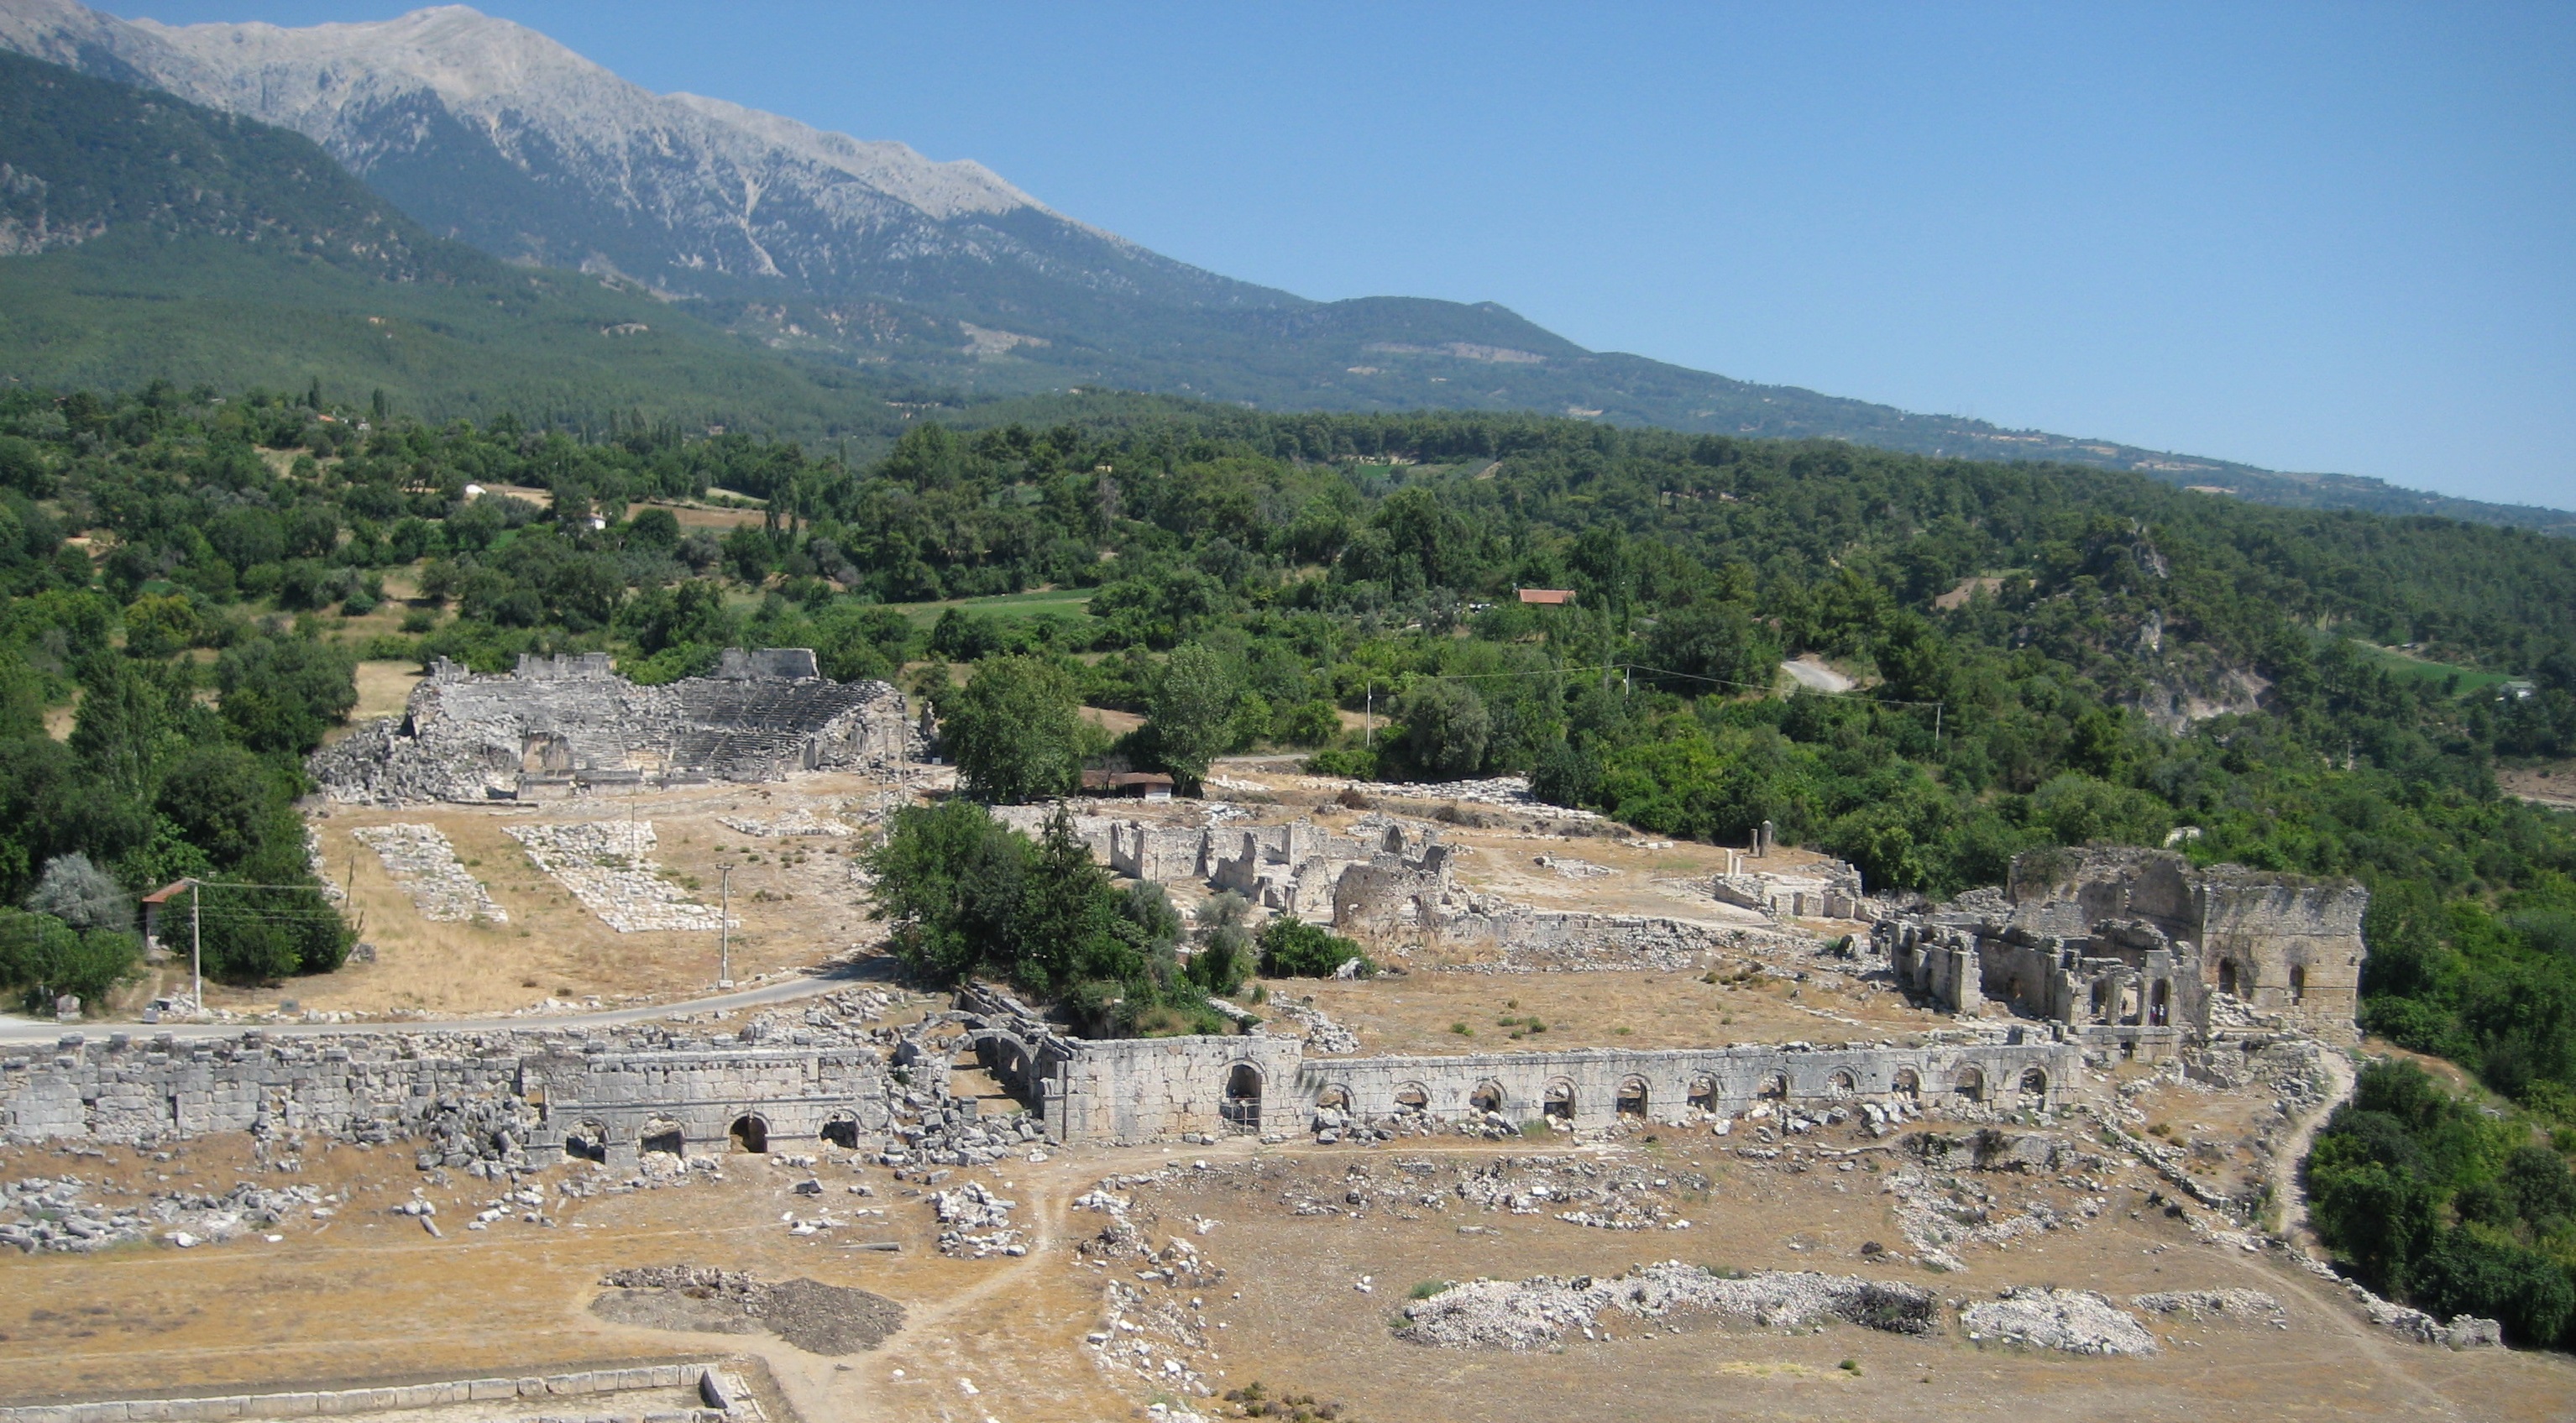
When I first started working on my dissertation project, all I really knew was that I wanted to explore cities. Roman architecture has a lasting presence in the landscapes of places as far removed from each other as Scotland and Libya, and along with the growth of trade and communication networks under the Roman Empire, cities across the Mediterranean all developed similar styles of public architecture, so that as you stroll through the ruined marble colonnades of a town on the coast of Spain, you could easily mistake your surroundings for a town in central Turkey. The visual power that these remains hold even today is fascinating, and as I set out on this project, I was determined to take a fundamentally comparative approach in order to explore the paradox underlying this apparently universal appearance of Roman cities. That is, although Roman architecture appears everywhere, I am most interested by the remarkable ways that local landscapes and the people inhabiting these ancient cities shaped those buildings into their own unique expressions of urban life in the provinces.
Once I had selected southwestern Turkey and, more specifically, the province of Lycia as my region of focus, as it is less well-studied than other parts of Turkey in the Roman period, I was faced with the task of compiling evidence on Roman-period architecture from at least half a dozen different archaeological sites, spread across two “micro-regions” with three sites located near the coast in a river valley and three more sites in the mountains to the north of the valley. Naturally, the next step was to create a database to organize this evidence into an easily accessible format. I decided to use the relational database program FileMaker Pro to do this, since it is standard software in my field, and over the course of many months inputting data on building plans, measurements, dates estimated by archaeological and inscriptional evidence, and numerous other pieces of information, my database took shape. In the end, it had over 100 buildings and complexes, some of which included multiple architectural features, and I was then faced with the task of figuring out what to do with all of this information.
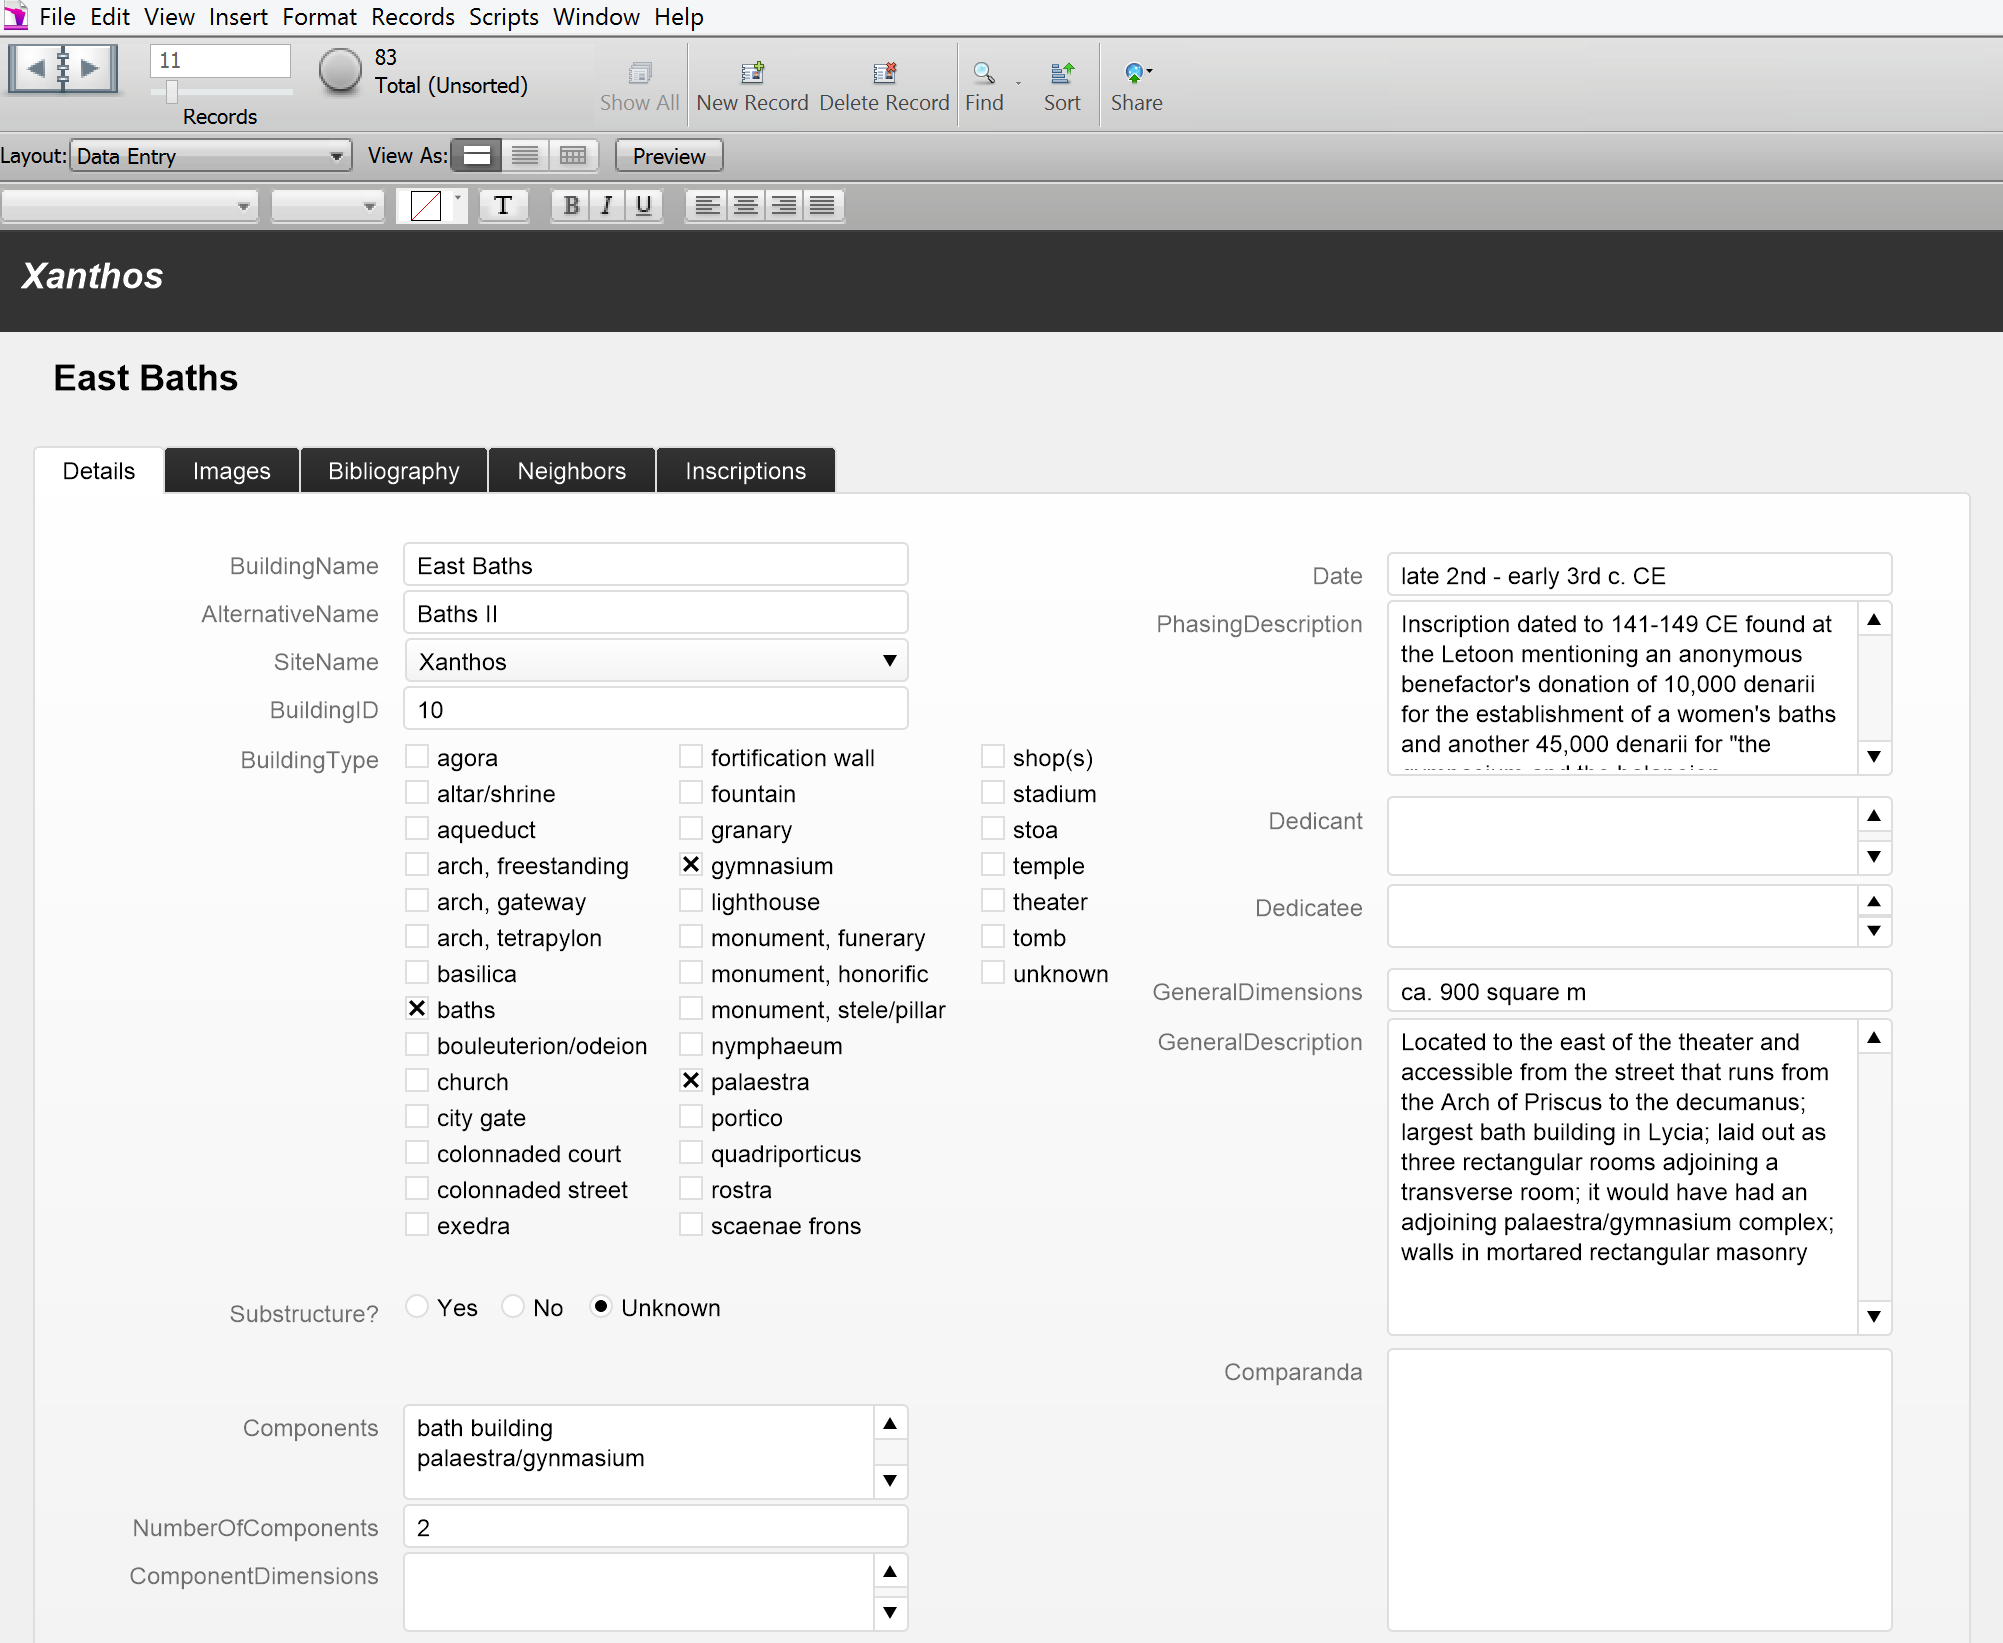
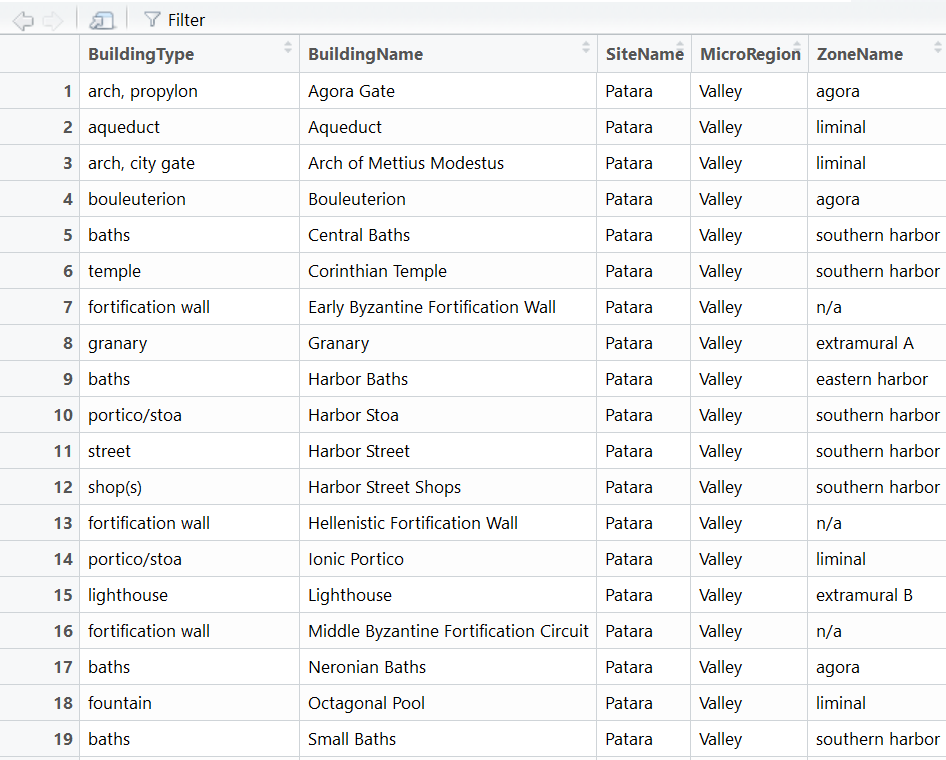
Although FileMaker Pro is an excellent database management program, it does not have much built-in functionality to help users explore or visualize their data in a way that can make patterns or connections between different data items readily apparent. Around the same time that I was becoming overwhelmed with the sheer amount of information I had assembled on the architecture from my six Lycian sites, I was introduced to the programming language R (by multiple different sources all at once, by happy coincidence). R is an open-source language used especially in statistics and data science for analyzing “big data” – meaning very large datasets, sometimes with millions of rows in a data table. It not only has excellent built-in graphing capabilities for data visualization and exploration, but because it is open-source, its globally active community of users are constantly creating new packages that you can download and install for added functionality. The result is that, no matter what types of research questions you want to ask about your dataset, there is almost always an R package out there that can help you address those questions. Since R makes it easy to work with tabular data (data arranged into rows and columns, like in most spreadsheets and databases), I exported my database as a .csv file from FileMaker Pro and imported it into R as a simple data table.
My approach to analyzing ancient urban remains is primarily spatial; so for any particular monument or building, I want to understand where in a city it was located and how its placement within the urban and physical landscape shaped the ways that people interacted with it or experienced it on a daily basis. The spatial connections between and among different monuments, complexes, and urban spaces can be modeled as a network. Like a social network, where each node in the network is a person and each edge represents a connection between people, I believed that modeling the connections between buildings and urban spaces could reveal interesting ways that the urban landscape was arranged. And because I am focused on the pedestrian experience of those buildings and spaces, each connection in the network would represent direct pedestrian access between a group of buildings or “urban zone.” R has numerous network graphing packages, but the one I found easiest to use is ggnetwork (created by François Briatt). This package uses one of the most popular graphing packages in R, ggplot2 (created by Hadley Wickham), to visualize network data. To use ggnetwork to plot the architectural layouts of my cities as nodal networks, it took me the extra step of creating a data table from my original dataset which added the pedestrian connections between complexes, but the results were very interesting. These nodal network diagrams allowed me to visualize, at a glance, how the architectural arrangement and pedestrian experiences of these Lycian sites compare across the region.

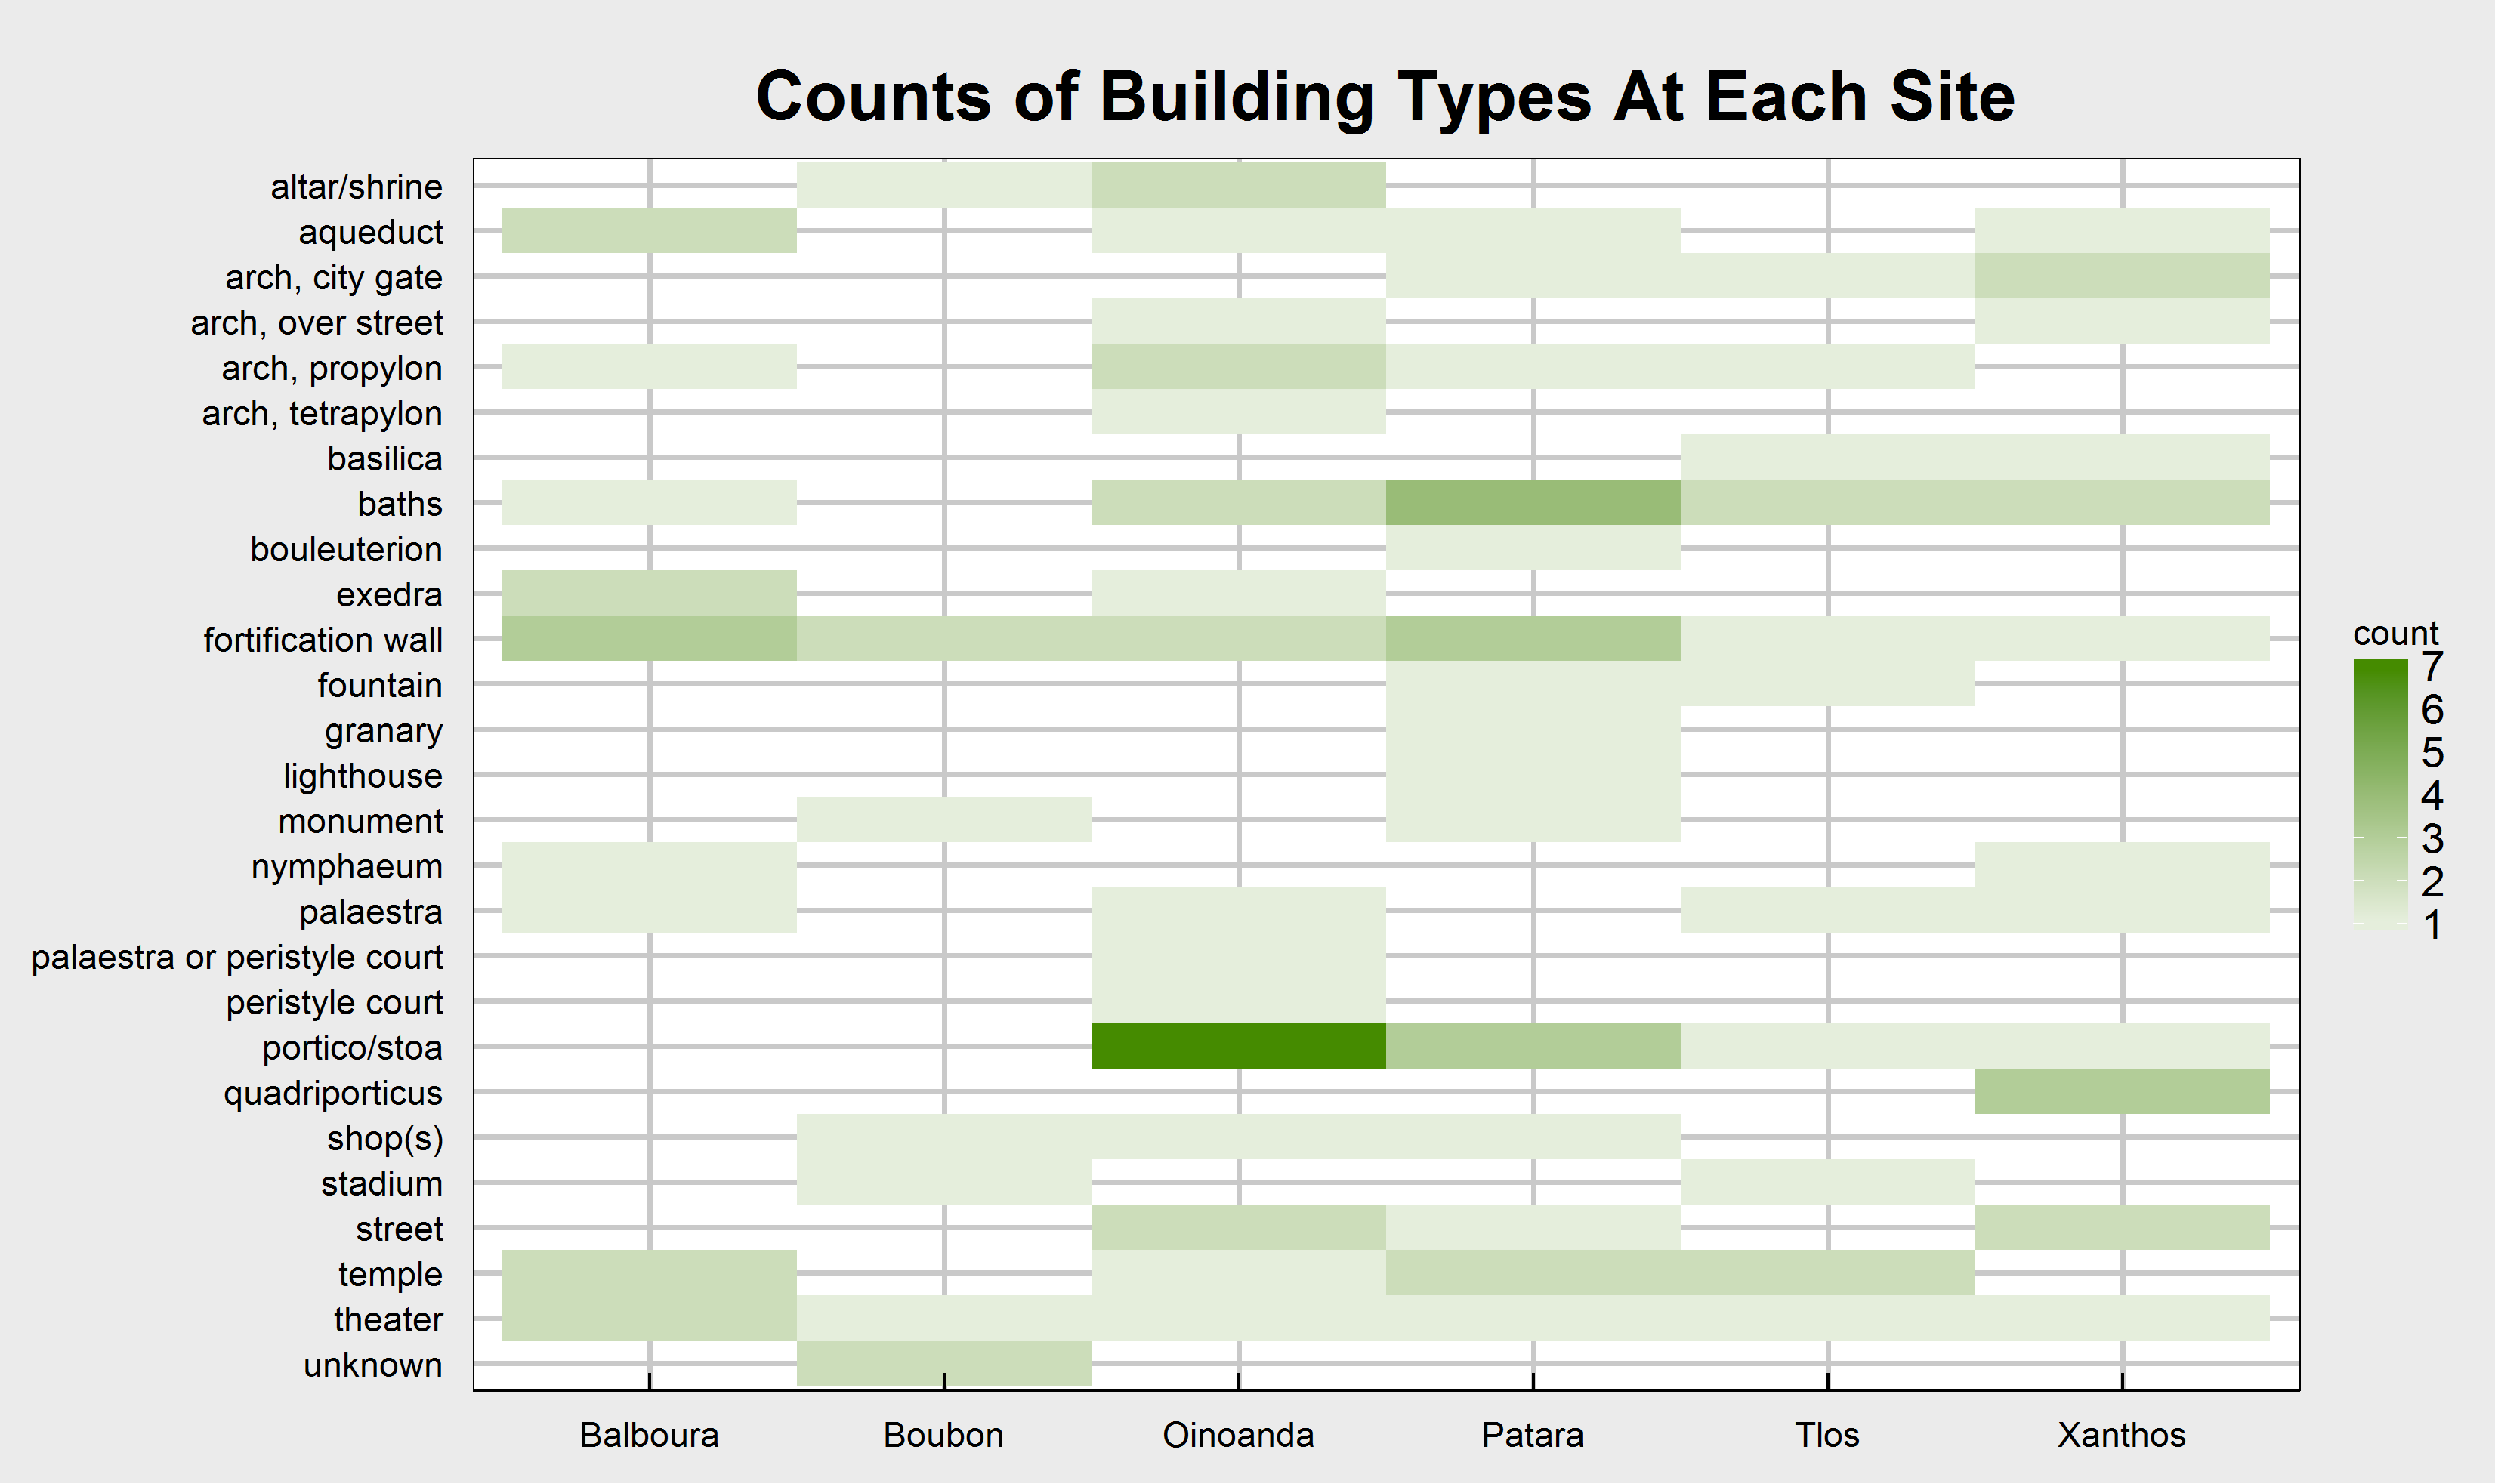
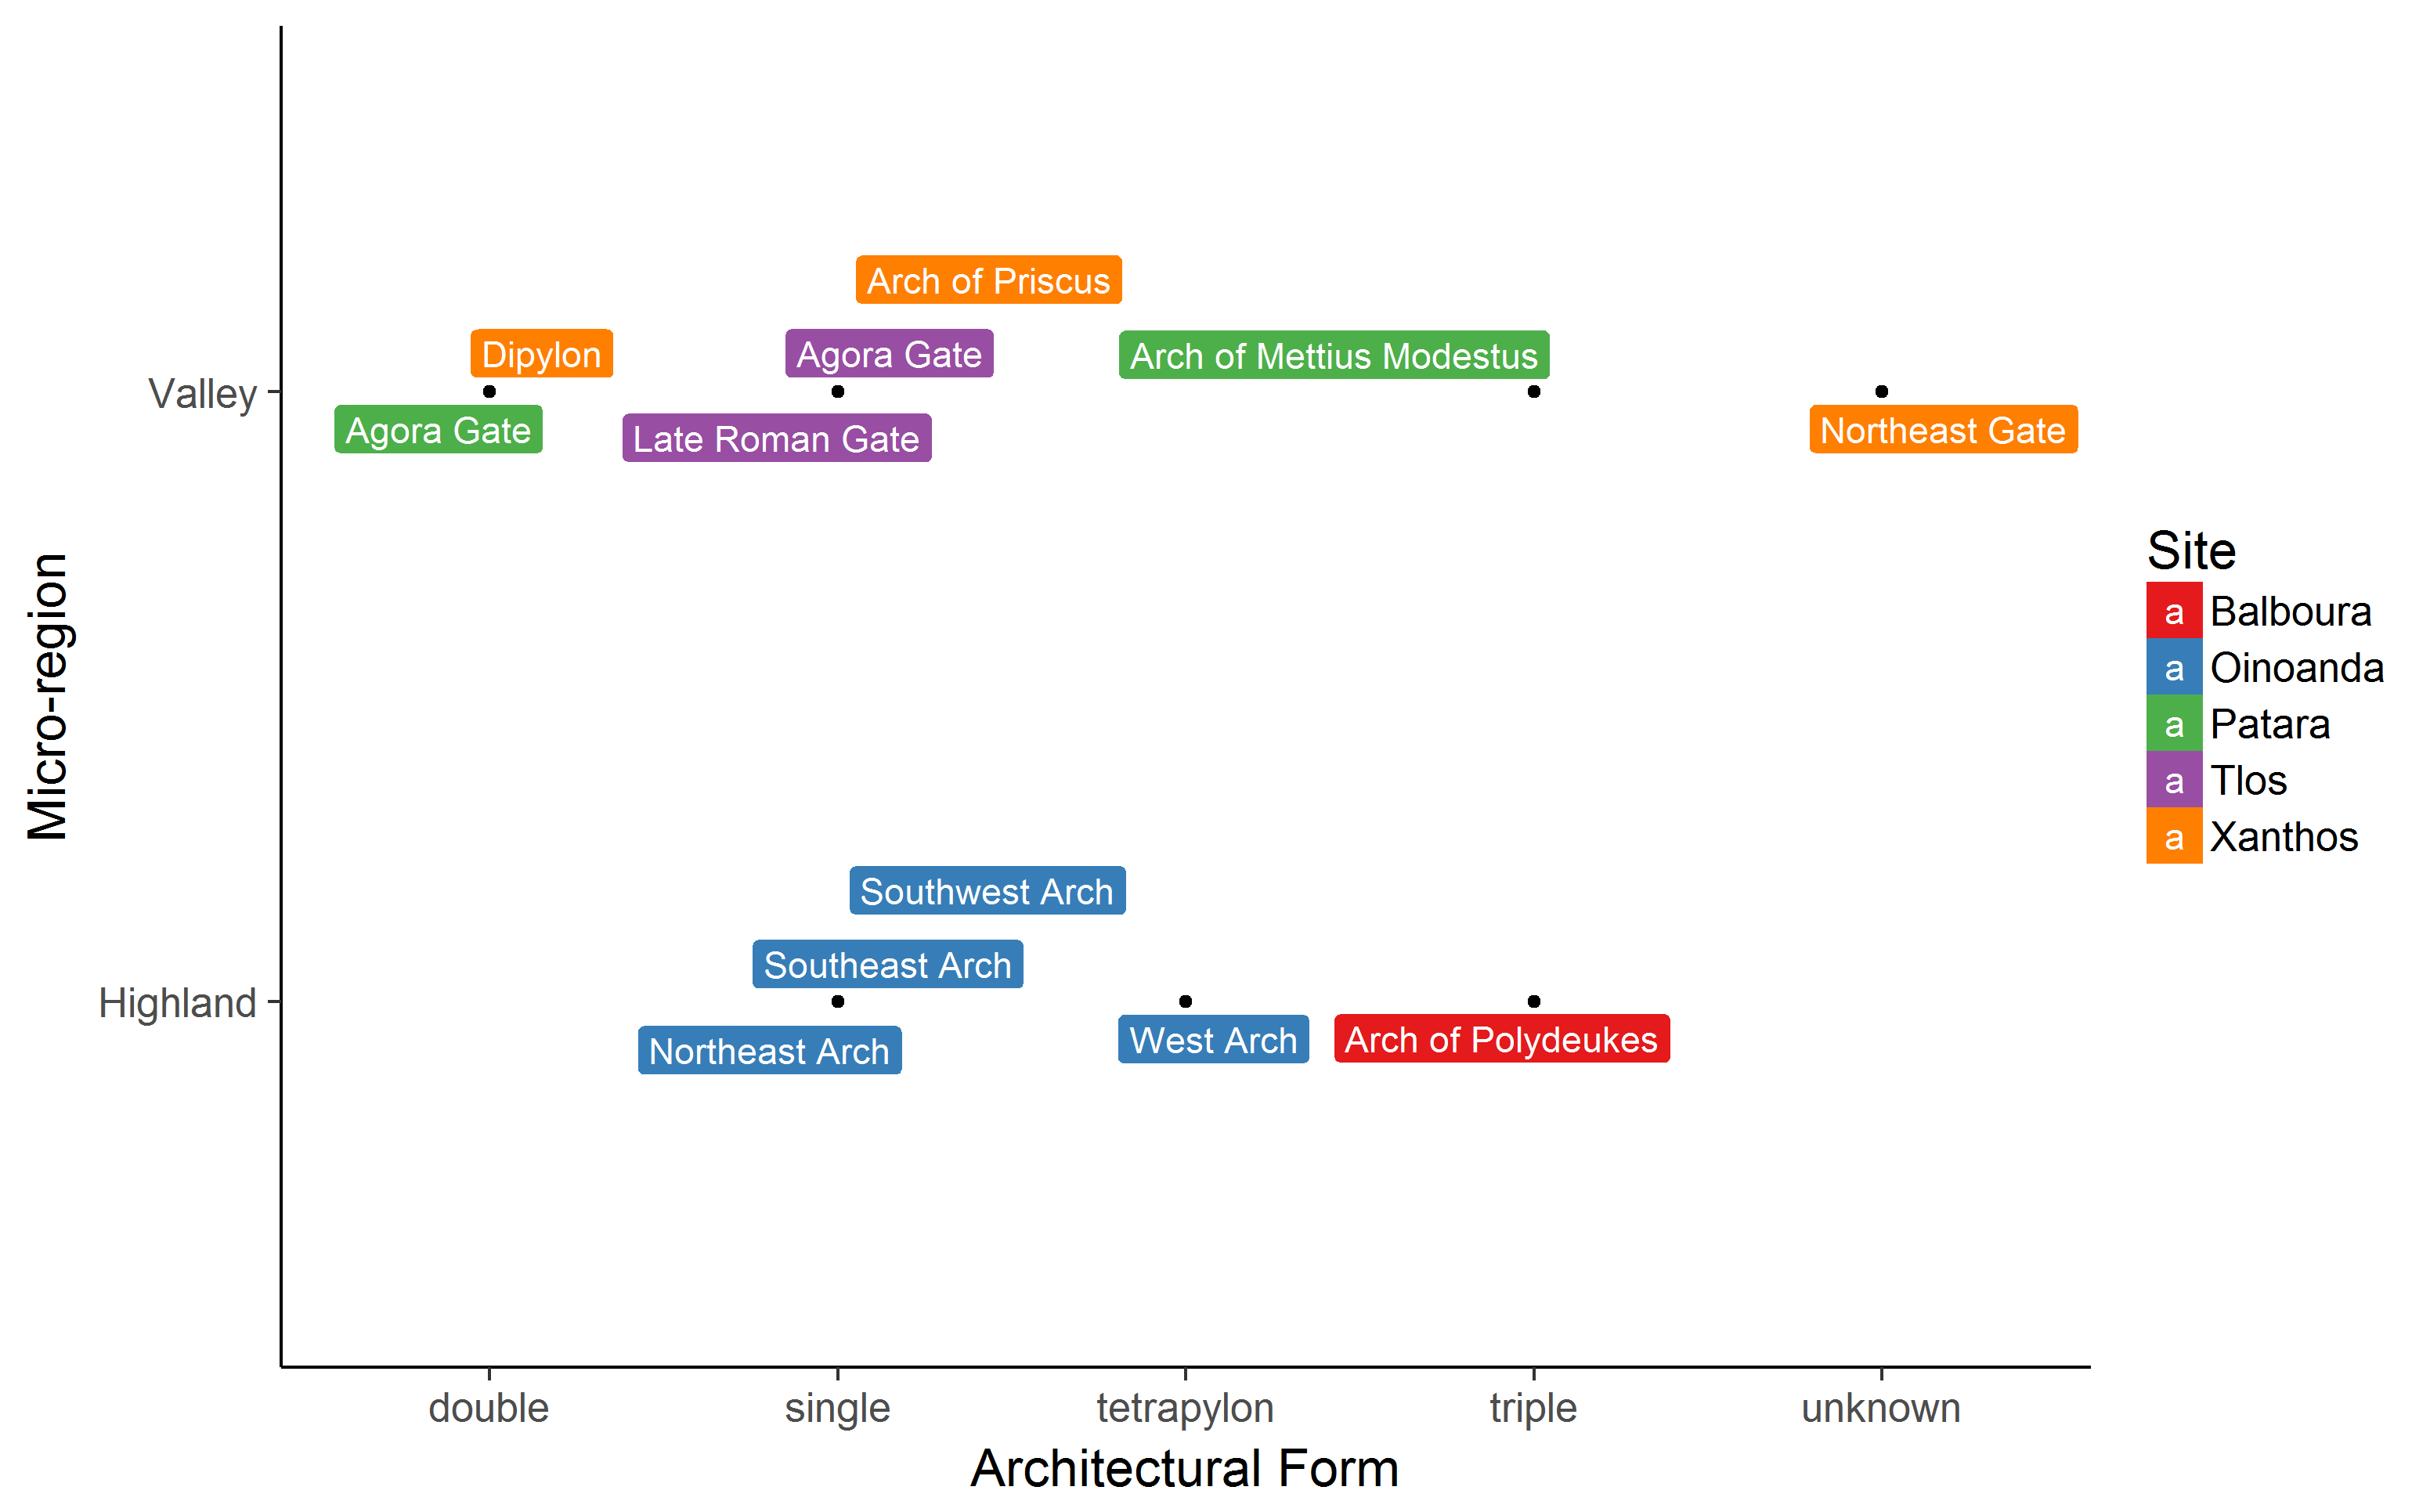
Another of my primary research questions relates to the types of buildings that appear in different parts of an ancient city, as well as the frequency of certain building types in the different cities in Lycia. Were monumental arches more likely to appear inside agoras? Are baths more common at some sites than at others? R allowed me to visualize the data and explore these questions very easily, as I was able to write short scripts to graph the data and re-run those scripts as many times as needed for each city or micro-region. Below are some examples of the exploratory graphs I created in this stage of my research.
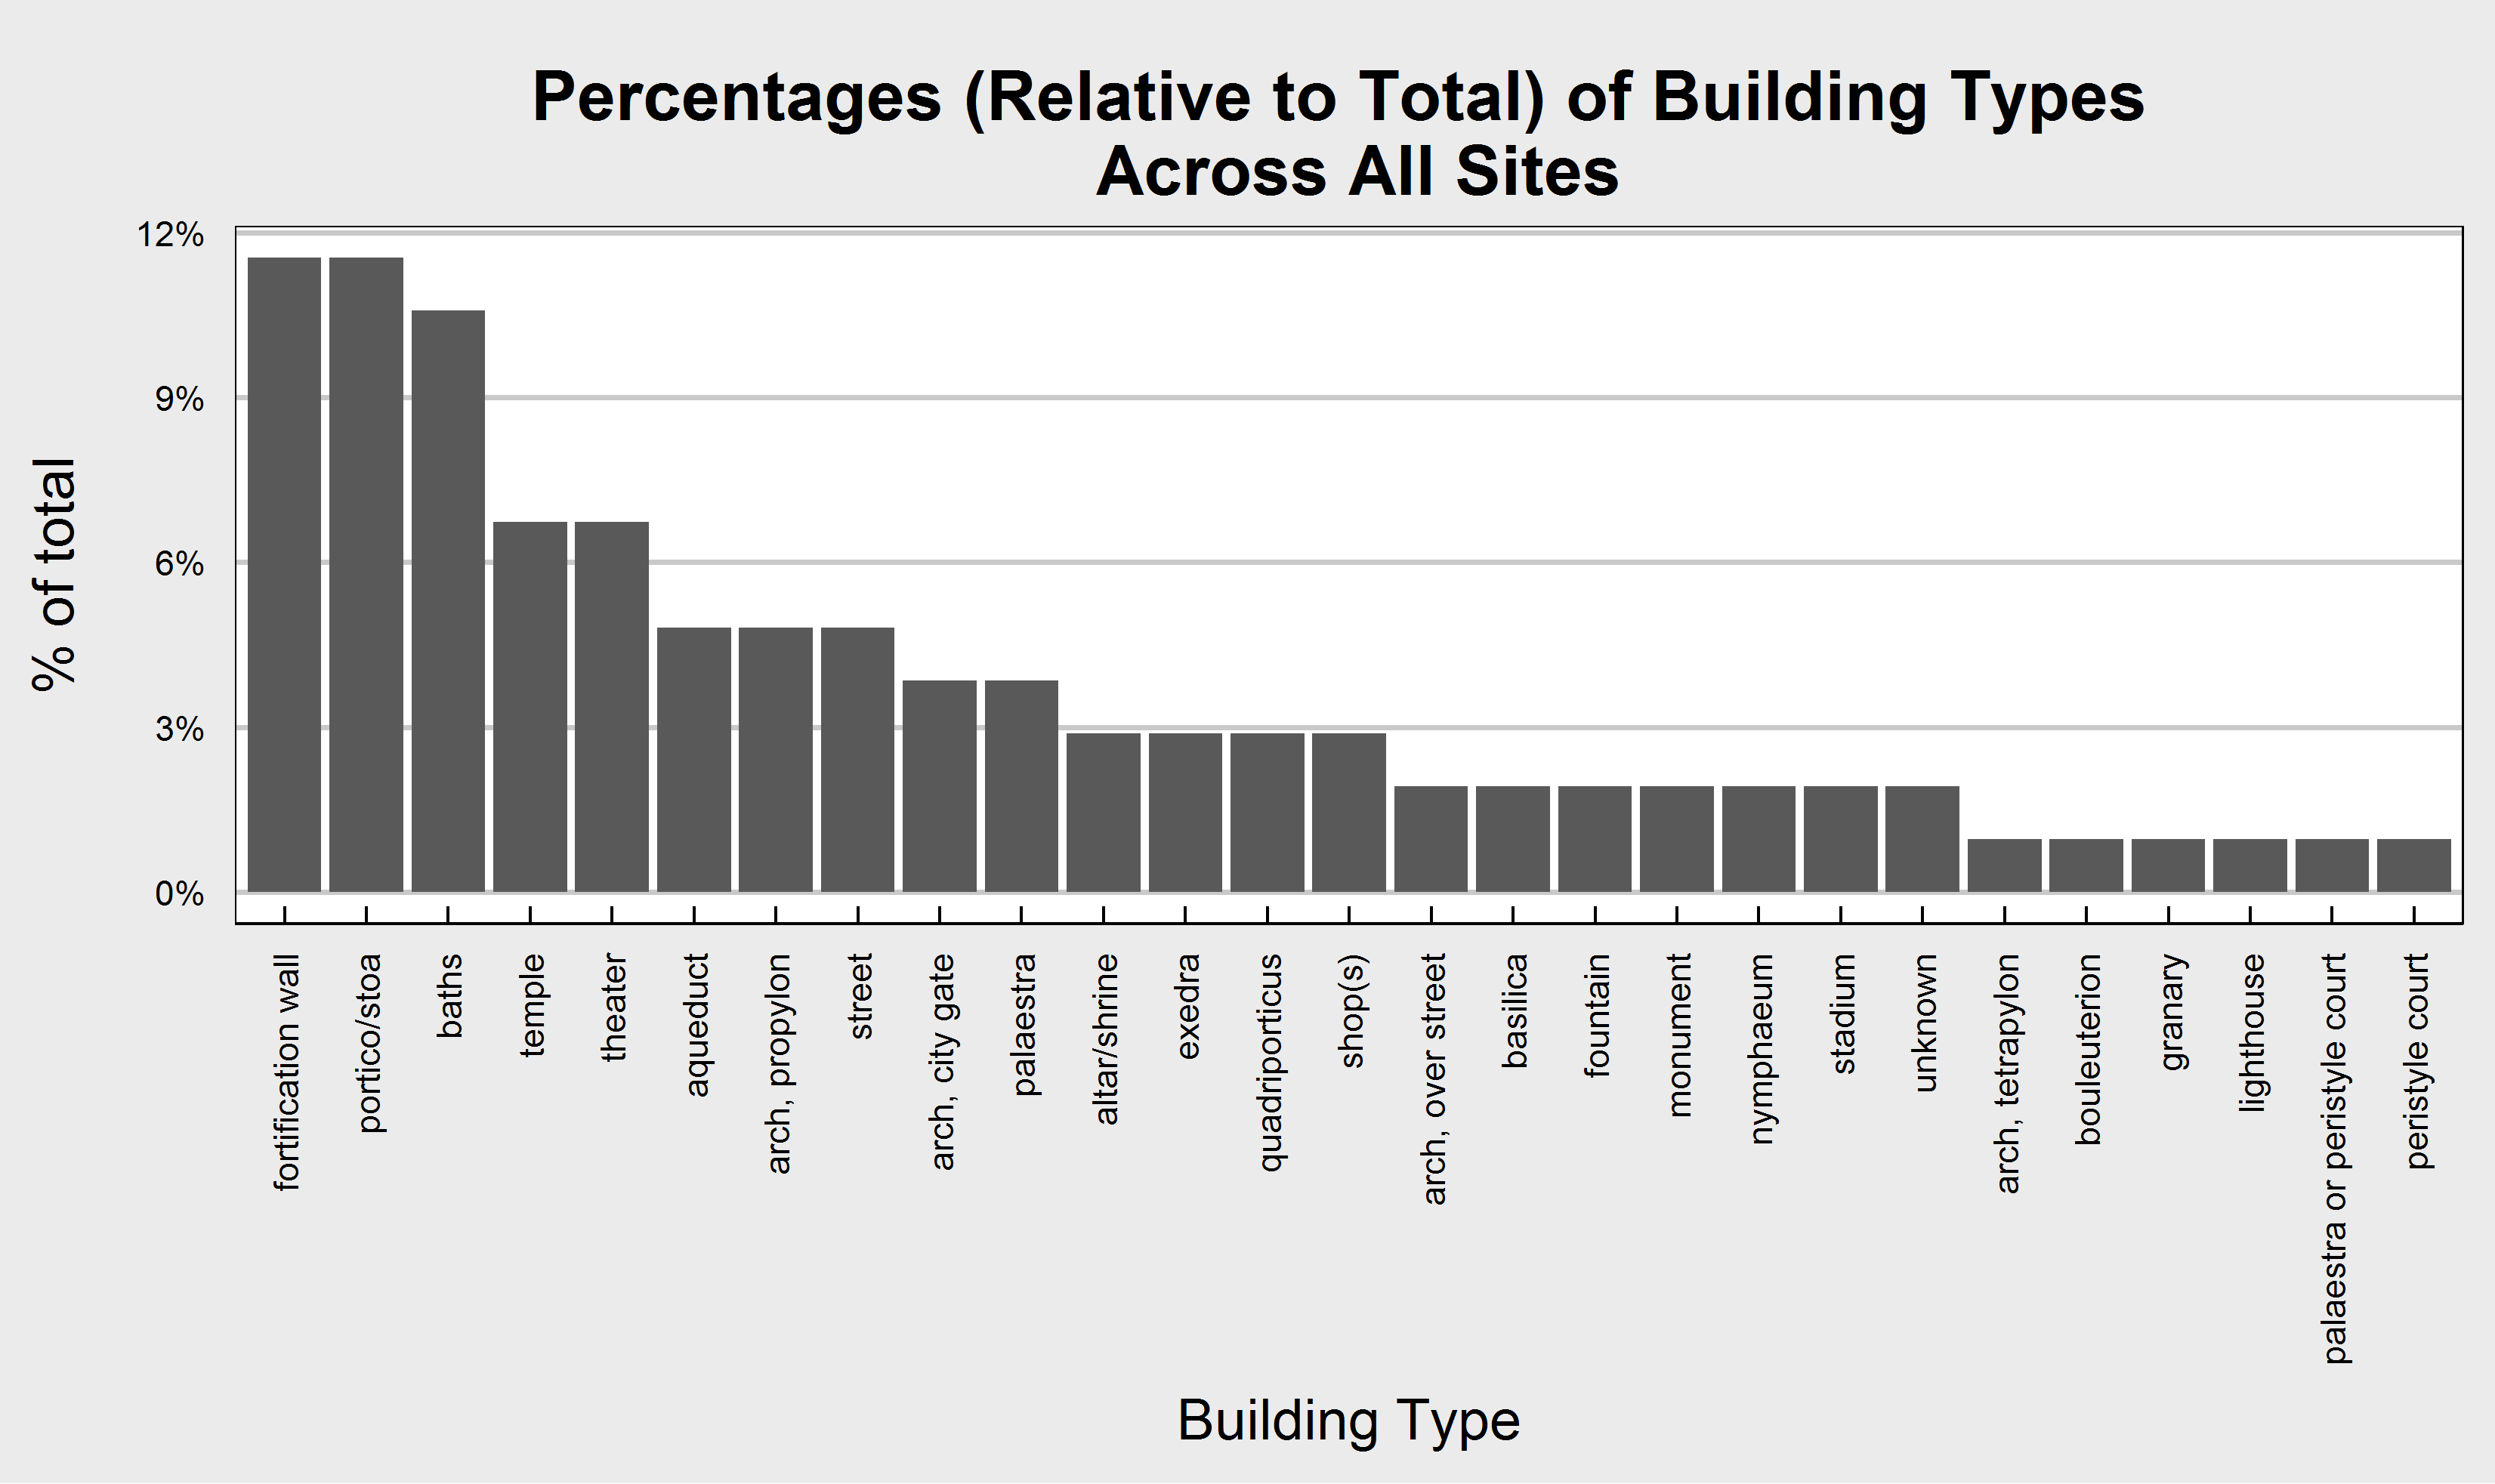
Once I had explored these questions, the patterns that became evident formed the basis for additional research and explanatory analysis using the standard interpretive tools of archaeology. For example, baths are much more common at the port city of Patara than at any other site in my study, a fact which might be related to the city’s connection to the sea or the number of visitors from around the Mediterranean it received every year during the sailing season. Exedras, which in Lycia are family monuments with benches arranged in a U-shape or a semi-circle, were overwhelmingly found in agora spaces rather than other parts of the city, perhaps because of their visibility in those bustling meeting places.

Having thoroughly explored my data and teased out patterns in building type, chronological development, and spatial arrangement across all six sites, I was able to address these and other issues in the chapters of my dissertation. R therefore became one of the most frequently used items in my research toolkit, adding to – rather than replacing – traditional methods of scholarly analysis. It has allowed me to think about my architectural evidence in new ways, suggesting new research questions and helping me re-formulate old ones.
The graphs and visualizations I have been able to create using R were not only valuable for my own exploratory research process, however. These visual means of representing evidence are also incredibly helpful for communicating the results of research to readers, and I have made use of R-produced charts in many of my dissertation chapters, where they are used to support my arguments and illustrate the ideas about architecture, patronage, and urban development that I explore throughout the thesis. In this way, R has been useful for practically every stage in the research and writing process, from thinking about my data in new ways to sharing the results with an audience.
More information about R is available in the Zotero group library for the Digital Scholarship learning community for R, located here. The R community of learning meets bi-weekly in the Carpenter Media and Collaboration Lab (every-other Friday at 1:00pm for Spring 2018).